Statistics in Integrative Medicine
Quality and cost effectiveness of our U.S. medical system have become major issues now, in 21st century, as first baby boomers turn sixty-two and get ready to retire. With our pension system badly underfunded by $1 trillion or more and ready to explode (ref. 1), the system may not be there to support us when we need it the most. An alternative? Maintain good health, and keep working. Do everything possible to avoid the inconvenience of a nursing home.
We realize that quality and cost-effectiveness are now hot topics and experts in this field are very few and in great demand, both in industry and academia. Regardless of technological advances and ambitious programs of early detection, the current U.S. system of medical care is failing to provide wellness and is not cost-effective. Further, ours is a "fee for seeing and treating sick patients" healthcare economy. We, the doctors, are not rewarded or paid for wellness. One of the recent examples is the State's of Oregon failed attempt of healthcare rationing. It failed and was scaled-down as it was based on the current inefficient, counterintuitive and disease-centered system. Further, our present system is based on early detection of preventable conditions such as heart disease, and breast cancer. Observed worldwide increasing prevalence of cancer, heart disease, allergies, Alzheimer's disease, osteoarthritis, and other chronic and progressive degenerative diseases is a proof of lack of successful prevention.
Exceptions to these failings of conventional Western medicine are Finland and Poland, two countries that enacted and successfully implemented responsible agricultural and environmental policies as well as social changes while at the same time enjoying good collaboration from their farmers and food industry (ref. 2). Finland dramatically reduced incidence of diabetes, strokes, and hypertension and both countries dramatically reduced cardiovascular deaths (Finland by over 80 percent).
To succeed in the U.S., we have to do the same. Fortunately, such a successful wellness program already has existed here, in Oregon, for almost twenty years. The following statistical analysis confirms this:
Doctors Get Evaluated
Recent advances in the health information technology allow us to dependably measure cost effectiveness and quality in health care. Physicians' offices and practices are monitored and periodically assessed. In our state this process is repeated every two years. The survey is typically conducted by a state medical organization and the data are made available to the insurance industry, as well to participating physicians. The National Committee for Quality Assurance (NCQA), HCFA, as well as state medical organizations set the standards.
In addition, multi-specialty practices, as well as individual physicians' practices receive utilization and quality review results that are provided courtesy of insurance companies using their vast claim data. Those are
intended to help physicians to self-improve. Those statistical data reflect the effort of teamwork; Behind every physician is a team of hard-working office personnel, as well as hospitals, outpatient testing facilities,
emergency room physicians, medical specialists, visiting nurses, and other care providers.
Our past statistics
Our present successes (as well as successes of our patients' and insurers') are nothing new. The following statistical data from the mid nineties confirm that our model of preventive and integrative medicine is a successful method of delivering quality medical care that is extremely cost-effective. We have proven that this medical approach is easy to implement in different towns, times, patient populations, and insurance systems. This includes HMOs, Medicare, Medicaid (For Oregon Health Plan – Oregon's welfare program: see Medicaid columns of the graphs below), and different practice arrangements.
Emergency room visits (1994 and 1995)
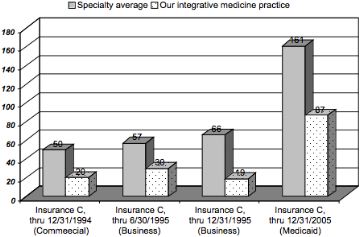
Figure 1: Emergency room visits per 1,000 adjusted members. (From Annual Provider Profile Reports.) This independent statistical analysis compares practice patterns of our Integrative Medicine practice to same specialty data (Insurance C of HMO-type, State of Oregon). Plans included: HMO commercial business, HMO commercial, and HMO serving Medicaid patients.
In-hospital medical services (1994 and 1995)

Figure 2: In-hospital medical services per 1,000 adjusted members. (From Annual Provider Profile Reports.) This independent statistical analysis compares practice patterns of our Integrative Medicine practice to same specialty data (Insurance C of HMO type, State of Oregon). Plans included: HMO commercial, HMO commercial business, HMO Medicare, and HMO serving Medicaid patients.
Medical care costs (1993-1996)

Figure 3: Cost per member per month in our Integrative Medicine practice as compared to the HMO average. Insurance D, State of Oregon. Please, notice higher initial costs. This initial cost allows prompt identification of health risk factors. Targeted corrective actions combined with simple and easy to implement wellness program allow our patients to reverse heart disease, relieve pain of arthritis, control diabetes and other chronic conditions. The result is a cost-effective medical care.
Our statistics for years 2002 to 2005:
Emergency room visits

Figure 4: Emergency room visits per 1,000 adjusted members. (Insurance A,
State of Oregon. Information based on 3 years of independent statistical
analysis of our integrative medicine practice.)
Hospital admissions
Figure 5: Hospital admissions (medical) per 1,000 adjusted members. (Insurance A, State of Oregon.)
Hospital days

Figure 6: Medical hospital days per 1,000 adjusted members. (Insurance A, State of Oregon.)
Our more recent statistics (ER and hospitalization comparative data for period from January 1, 2005, to present) are even better. Following graphs are examples of prescription medication use, and for this reason are good indicators of the state of health (of mind and body) of our patients.
Prescription costs, integrative medicine

Figure 7: Average cost of prescription medications per patient (in U.S. dollars). Our prevention oriented integrative medicine practice is compared to average prescription medication costs in similar patient population. (Insurance B, State of Oregon.)
Prescription nonsteroidal medication use in our integrative medicine practice
Figure 8: Prescription nonsteroidal anti-inflammatory drug use (NSAIDs), comparative data. Average prescription cost for NSAIDs per month/claim in our practice (Insurance A, State of Oregon.)
Prescription antidepressant use

Figure 9: Prescription antidepressant drug use, comparative data (Reporting period: 4/1/2005 through 9/30/2006). Average antidepressant use in our integrative medicine practice is compared to statewide data and a similar group of physicians. The chart is based on pharmacy and medical claims data that was prepared by impartial reviewers and presented to me by a reputable health plan. (Insurance A, State of Oregon.)
As above statistical analysis indicates, our Program of Wellness and Facilitated Healing provides quality medical care while avoiding use of synthetic medicines known to possess inherent risks and that contribute to water pollution. (ref. 3)
Our most recent statistics:
Our prictice is consistently rated THE BEST in utilization and cost-effectiveness!
Medical care we provide is very cost effective. We have received, and continue to receive, detailed profiles of utilization (costs), quality of medical care, and quality of outcomes of medical care for years since early 90’s.
The following example is from the most recent one-year report ending on 3/31/2010. It was mailed to us in May of 2010 by one of the largest insurance company/hospital system (Insurance A) in the State of Oregon.
- PCP Utilization Profile Detail. 4/1/2009 Through 3/31/2010 Service Dates. PCP: Jan Radzik MD. Specialty Comparison: Family Practice/General Practice. You Are in the Top Quintile – the best!
- Congratulations, your performance is at or exceeds benchmark levels. Please keep up the great work!
We have also received identical congratulatory statements for the following one-year periods:
4/1/2002 – 3/31/2003; 1/1/2004 – 12/31/2004; 4/1/2004 – 3/31/2005; 1/1/2005 – 12/31/2005; 10/1/2005 – 9/30/2006; 7/1/2008 – 6/30/2009; 10/1/2008 – 9/30/2009; 1/1/2009 – 12/31/2009; 4/1/2009 – 3/31/2010.
Prescription medication use, cost per prescription, Insurance B:

Figure 10: Prescription medication use: Cost per prescription. Our practice (Red Markers) is compared to average for Family Practice in the State of Oregon, insurance B (Black markers).
Average cost of prescription medications per 30 days/claim, Insurance A:
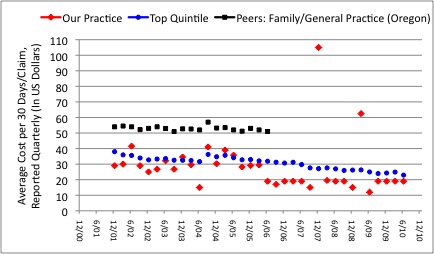
Figure 11: Average cost of prescription medications per 30 days/claim in our medical practice (Red markers) as compared to Family Practice/General Practice (Data for the State of Oregon, Insurance A). We consistently achieve or beat the benchmarks. Blue markers represent the most cost-effective quintile. The average for Family Practice/General Practice in the State of Oregon was much higher, at about $52.00 (Black markers).
Please, note: The average cost per prescription medication for the Family Practice/General Practice in the State of Oregon was about $52.00 per prescription. Our values for quarters ending 6/06, 12/06, 3/07, 6/07, 6/08, 9/08, 9/09, 12/09, 3/10 and 6/10 that are reported as 19 are at, or below that level, the minimum reported range. Values for peers (black) were provided to us only until the end of 2nd quarter of 2006.
Emergency department visits per 1000 adjusted members:

Figure 12: Emergency Department Visits Per 1000 Adjusted Members. Our medical practice (Red markers) is compared to average for Family Practice/General Practice in the State of Oregon, insurance A. Yellow markers represent the top (best) quintile.
Comment: Think of emergency room visits and hospital admissions as consequences of failure of outpatient care and failure of primary prevention. The fewer hospital admissions and fewer days spent in hospital, the better for patients and employers. In such reformed and wellness-oriented system, hospitals need special protection: As hospitals and emergency rooms are vital community resources, their budgets have to be fully protected from market and patient load related revenue fluctuations. Unfortunately, insurance companies in the U.S. don't pay physicians and hospitals for keeping patients well; they pay for seeing and treating sick people.
Potentially avoidable respiratory hospital admissions per 1000 respiratory members:

Figure 13: Potentially Avoidable Respiratory Hospital Admissions Per 1000 Respiratory Members. Our medical practice (Red markers) is compared to average for Family Practice/General Practice in the State of Oregon (Data provided to us by Insurance A). Evidently, our preventive medicine program is very effective here.
Medical hospital admission rates per 1000 adjusted members:

Figure 14: Medical Hospital Admission Rates Per 1000 Adjusted Members. Our medical practice (Red markers) is compared to average for Family Practice/General Practice in the State of Oregon (Black markers), insurance A.
Medical hospital days per 1000 adjusted members:

Figure 16: Medical Hospital Days Per 1000 Adjusted Members. Our medical practice is compared to average for Family Practice/General Practice in the State of Oregon, insurance A.
Surgical hospital days (Non-OB) per 1000 adjusted members:
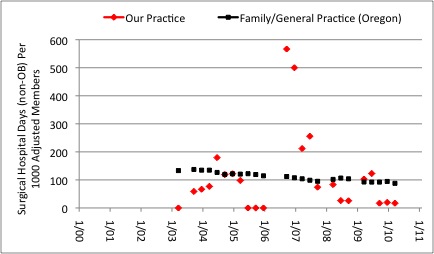
Figure 17: Surgical Hospital Days (Non-OB) Per 1000 Adjusted Members. Our medical practice (Red markers) is compared to average for Family Practice/General Practice in the State of Oregon, insurance A.
Medical Medical Cost Per Adjusted Member:
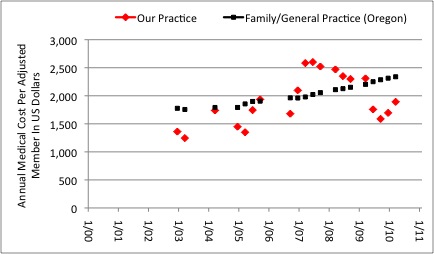
Figure 18: Annual Medical Cost per Adjusted Member. Our medical practice (Red markers) is compared to average for Family Practice/General Practice in the State of Oregon (Black markers), insurance A.
Quality Pays
W. Edwards Deming, a recognized quality guru, was right stating that quality is the key to productivity, more jobs and richer society. He got industrialists to listen and his ideas became widely accepted and implemented. Not here, in his native U.S., but in the land of longevity... in Japan. Soon, quality brought in good results and domination in niche markets. After cameras and mini-tape players, Japan took on cars and made them as energy-efficient as elegant.
Now, I witness a new wave of excellent products made in Europe and Japan that follow Deming's principle: quality natural medicines. By embracing production and use of natural medicines that tap the enormous healing power of nature and are non-toxic to our body and environment, Japan is on a fast track to become one of dominant players and trendsetters in the world of Green Medicine. Besides Asia and Europe where natural medicines are traditionally part of their medicine, natural medicines are becoming increasingly popular in the U.S., Australia, and New Zeeland. There is a worldwide interest in a non-polluting and cost effective Green Medicine. The Integrative Medicine depends heavily on Green Medicine as it uses nutritional interventions, standardized and non-toxic natural supplements, vitamins, and botanical products that are safe to aquatic life and rivers, our source of quality food and water. This is a good news for our patients and planet. However, when needed, Integrative Medicine utilizes life-saving antibiotics and appropriate prescription medications, advanced diagnostics, and all other available resources of today's medicine that include community hospitals and university medical centers.
We now know that quality in medicine does not cost, it pays! When it comes to medical care, it is the Integrative Medicine that provides the excellence and cost effectiveness of care. Patient-friendly, it delivers wellness, disease prevention and disease reversal (facilitated healing), for less.
1. Geoffrey Colvin's article in January 23, 2006, issue of FORTUNE Magazine, explains dire situation of American pension system of private and State employee pension plans: Tick, Tick. Boom! Terror alert: Americas pension time bomb is ready to explode. Underfunded or outright defunct, pension plans may not be there when needed most-during the years of retirement.
2. Jaakko Tuomilehto, MD, of the National Public Health Institute, Kuopio, Finland. Information from a lecture by Dr. Tuomilehto presented at the European Society of Cardiology convention in Barcelona, Spain August 31, 2009).
3. "Academics, state officials and environmental advocates are starting to question whether massive amounts of discarded pharmaceuticals which are often flushed down the drain, pose a threat to the nation's aquatic life and possibly people." "In waterways from the Potomac to the Brazos River in Texas, researchers have found fish ladden with estrogens and antidepressants, and many show evidence of major neurological and physiological changes." (An article by Juliet Eilperin: "Pharmaceuticals in Waterways Raise Concern - Effects on Wildlife, Humans Questioned." Washington Post, June 23, 2005.)
